
Kagi chart
Kagi chart noun: a style of financial chart, mostly independent of time, used to track price movements and make decisions on purchasing stock.
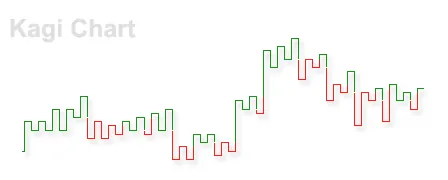

Noun
Kagi chart (plural Kagi charts)
Forms of Kagi chart
| plural | Kagi charts |
|---|
Origin of Kagi chart
From Japanese [Term?].
Questions about Kagi chart
- What does Kagi chart mean?
- Kagi chart means a style of financial chart, mostly independent of time, used to track price movements and make decisions on purchasing stock.
- What part of speech is Kagi chart?
- Kagi chart is a noun.
- What is the plural of Kagi chart?
- The plural of Kagi chart is Kagi charts.
Words near Kagi chart in the dictionary
Source and license
Adapted from Wiktionary: Kagi chart (page history and authors). Text available under the Creative Commons Attribution-ShareAlike 4.0 license. Word.ws reformatted the entry and added links. Wiktionary data of 2026-09-02.
Last updated:
Cite this entry: “Kagi chart.” Word.ws, https://word.ws/kagi_chart. Based on Wiktionary, CC BY-SA 4.0.