
Nolan chart
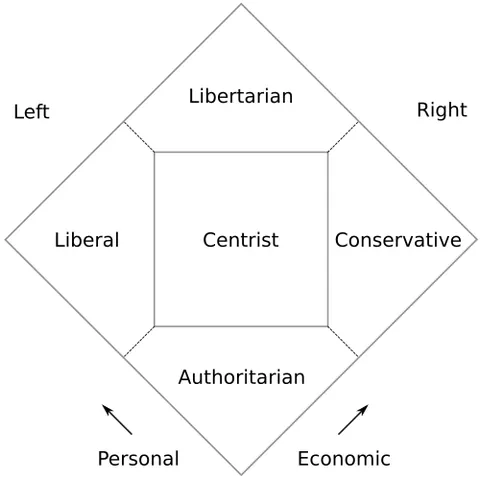
Nolan chart noun: a two-dimensional chart that graphs the political spectrum, mapping cultural issues on one axis and economic issues on another axis to represent conservatism, libertarianism, and their opposites.

Noun
Nolan chart (plural Nolan charts)
- A two-dimensional chart that graphs the political spectrum, mapping cultural issues on one axis and economic issues on another axis to represent conservatism, libertarianism, and their opposites.
Forms of Nolan chart
| plural | Nolan charts |
|---|
Origin of Nolan chart
Created by American politician David Nolan in 1969.
Questions about Nolan chart
- What does Nolan chart mean?
- Nolan chart means a two-dimensional chart that graphs the political spectrum, mapping cultural issues on one axis and economic issues on another axis to represent conservatism, libertarianism, and their opposites.
- What part of speech is Nolan chart?
- Nolan chart is a noun.
- What is the plural of Nolan chart?
- The plural of Nolan chart is Nolan charts.
Words near Nolan chart in the dictionary
Source and license
Adapted from Wiktionary: Nolan chart (page history and authors). Text available under the Creative Commons Attribution-ShareAlike 4.0 license. Word.ws reformatted the entry and added links. Wiktionary data of 2026-09-02.
Last updated:
Cite this entry: “Nolan chart.” Word.ws, https://word.ws/nolan_chart. Based on Wiktionary, CC BY-SA 4.0.